
By Onkar Mandhare
29 Aug 2026
Industry: AI / Conversation Intelligence (Contact Center QA Automation)
Location: AWS (region-parameterized, default us-east-1)
The core workload — automatically grading customer-service call transcripts against QA rubrics using an LLM — needed an inference platform that could do three things at once: run reliably across a fleet of different NVIDIA GPU generations (A10G, L4, L40S, and the newer Blackwell RTX PRO 6000), scale up and down without wasting spend on idle GPUs, and give the team hard evidence — not guesses — about latency, throughput, cost, and answer quality before any capacity or SLA commitment was made.
Early single-run benchmarks were misleading: at a concurrency of just one, Time-to-First-Token swung from ~3.2s to ~15s across only five requests, which meant any decision based on a single benchmark run risked being built on noise rather than signal.
The project delivered a self-provisioning GPU platform on Amazon EKS paired with a rigorous, repeatable benchmarking and SLA-grading harness:
1. Amazon EKS + Karpenter. A Kubernetes 1.36 cluster where Karpenter auto-provisions GPU nodes on demand across a heterogeneous fleet (g5/g6/g6e whole-GPU families and g7/g7e Blackwell), and scales them back to zero when idle — so the platform never pays for GPU capacity it isn't using.
2. NVIDIA GPU Operator with MIG. Blackwell cards are partitioned via MIG so a single 96GB card serves multiple workloads as 48GB slices, while older GPU families run whole-card. Because the GPU Operator advertises every MIG slice and whole card as the same nvidia.com/gpu resource, one Kubernetes Deployment schedules transparently across the entire mixed fleet.
3. A single vLLM image spanning every GPU generation. One vllm-openai build compiled for sm_80 through sm_120 (Ampere through Blackwell), pinned to a CUDA range that satisfies both the 580-series and 595-series NVIDIA drivers across the fleet — avoiding the operational overhead of maintaining separate images per GPU family.
4. Two-tier model weight caching (S3 + host-local NVMe). Model weights are pulled from Hugging Face exactly once and stored durably in S3; every node then hydrates a local host-path cache from S3 (never from Hugging Face again). Pod restarts and instance reboots reuse the host cache instantly, and only a full node replacement triggers a fast in-region copy from S3 — eliminating repeated ~8GB network downloads on cold start.
5. AWS Load Balancer Controller + ALB Ingress. vLLM is exposed through a Kubernetes Ingress on the cluster's default alb IngressClass, with health-check gating so traffic only reaches a pod once the model has finished loading.
6. Observability via kube-prometheus-stack + DCGM. Prometheus, Grafana, and NVIDIA DCGM GPU telemetry are installed alongside the model-serving stack, plugging directly into vLLM's native /metrics endpoint with no extra instrumentation.
7. A statistically-honest benchmarking harness. A perf-sweep tool drives configurable concurrency levels against the endpoint, and an aggregation script (aggregate_runs.py) repeats each concurrency level multiple times and reports mean ± standard deviation per metric — replacing single-run numbers (which the team had already seen vary by 5x) with results that can actually be trusted.
8. Config-driven SLA grading. A YAML-defined SLA contract (config_sla_example.yaml) turns raw benchmark output into an automated PASS / CONDITIONAL / FAIL verdict against explicit targets — TTFT p95, inter-token-latency p95, error rate, minimum throughput, cost per million tokens, and per-task quality thresholds (e.g., accuracy floors) — plus a cost model built from real instance hourly rates.
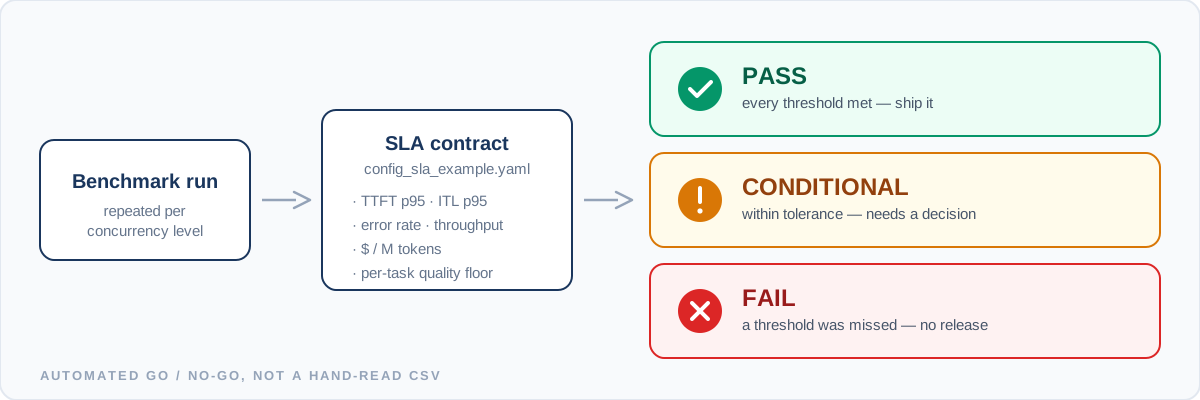
Figure 1 — Every benchmark run resolves to one of three verdicts, so a release decision never depends on someone eyeballing a CSV.
9. Production-representative load testing. Rather than synthetic noise, the harness was validated against a realistic retail customer-service dataset — 250 QA-rubric-scored call transcripts and a 20,000-request burst queue arriving inside a ~3-minute-15-second window — with per-account prompt-token-length distributions used to shape realistic traffic rather than a flat, unrealistic load.
DeployByDesign's pitch is simple: research-grade GPU and CPU workspaces — JupyterLab, RStudio, VS Code, MLflow — provisioned in minutes, with no cluster to configure. For a project like this one, that simplicity translated into concrete, day-to-day benefits.
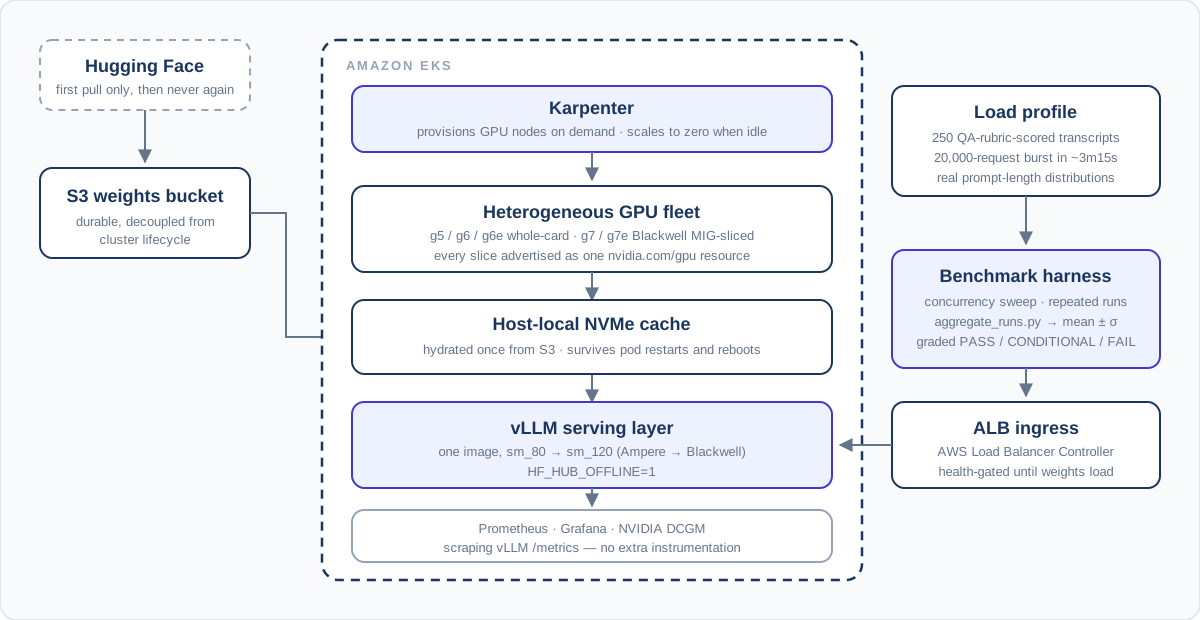
Figure 2 — Weights flow from S3 into the Karpenter-managed GPU fleet, through the host-local cache, into vLLM, and out through the ALB to the benchmark harness and observability stack.
The team ran its benchmarking and experimentation on DeployByDesign-provisioned GPU workspaces and its serving layer on Amazon EKS in production — a setup that normally means maintaining two separate mental models, two sets of tooling, and two places where things can quietly diverge. DeployByDesign kept a consistent workspace experience across both, so the team could move between the benchmarking sandbox and the production cluster shown in Figure 2 without relearning infrastructure quirks every time they switched context.
Splitting benchmarking experiments from the production AWS account usually comes with a quiet tax: duplicated credentials and permissions that have to be manually kept in sync on both sides. DeployByDesign's cross-account role support meant the team could manage access across the benchmarking workspace and the production EKS account without maintaining two separate, brittle sets of credentials — one less thing standing between a configuration that worked in a benchmark run and one that was ready for production.
This platform wasn't built by one team working in isolation — it came together through close collaboration between the infrastructure engineering team tuning Karpenter NodePools and MIG slicing, and the applied-AI team defining SLA thresholds and quality rubrics. DeployByDesign's shared workspaces let both sides work inside the same environment in real time, instead of everyone maintaining separate setups and reconciling results afterward. For a project moving constantly between GPU-fleet infrastructure work and SLA-grading logic, that shared context mattered.
The stack spanned Python-based benchmarking scripts, YAML-defined SLA configs, and vLLM serving code that needed rapid, notebook-based iteration. Having JupyterLab, RStudio, and VS Code available out of the box, provisioned in minutes rather than hours, meant new engineers and collaborators could get productive almost immediately — critical when coordinating a cross-team build between infrastructure and applied AI.
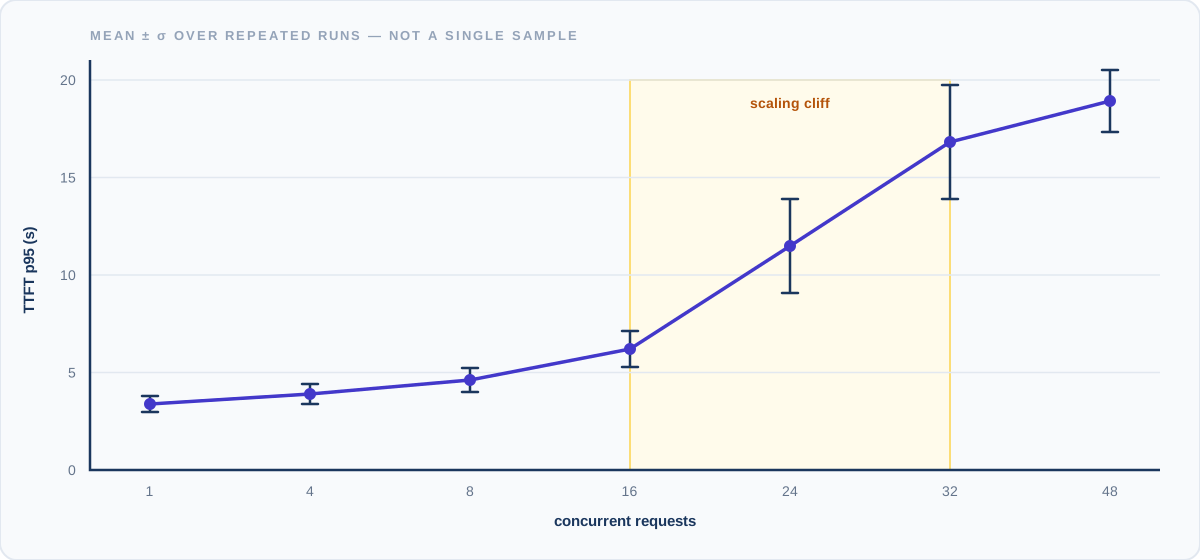
Figure 3 — Illustrative TTFT curve across concurrency levels. Repeating each level and reporting mean ± standard deviation, instead of a single run, is what makes the scaling cliff between roughly 16 and 32 concurrent requests trustworthy rather than noise.
This platform's architecture already leaned on Amazon EKS, Karpenter, S3, and the AWS Load Balancer Controller for the heavy lifting of GPU provisioning and traffic routing. What the team needed from the workspace layer wasn't more infrastructure to manage — it was a way to reduce the number of moving parts they had to think about day to day. DeployByDesign let compute be something they could spin up, use, and tear down without it becoming its own project.
A lot of the tooling in this space is built for one persona — either the researcher who wants a notebook, or the platform engineer who wants a hardened production pipeline. This project needed both, often in the same week. Being able to prototype an SLA-grading rule in a notebook and move that logic toward the production AWS environment, without the workspace itself being the bottleneck, shortened the distance between "this looks promising" and "this is live."
HF_HUB_OFFLINE=1).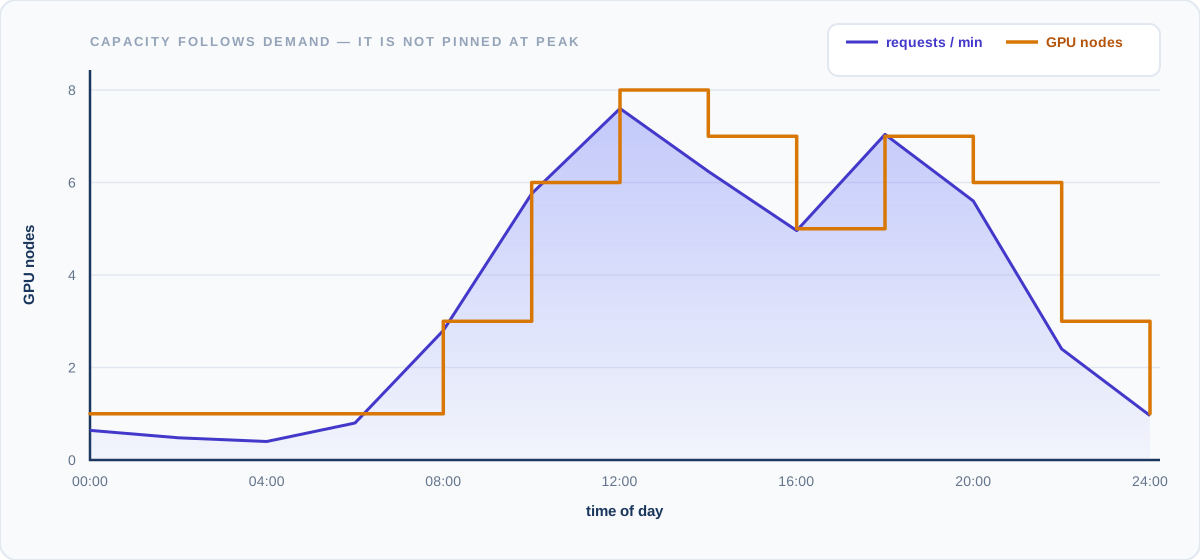
Figure 4 — Karpenter tracks the request-volume curve through the day, so GPU node count rises and falls with real demand instead of sitting fixed at peak capacity.
This project moved the team's LLM infrastructure decisions from single-run guesswork to a repeatable, evidence-based process: a heterogeneous GPU platform that scales elastically on AWS EKS, paired with a benchmarking harness that treats variance as a first-class citizen rather than an inconvenience. The result is a platform the team can trust to answer "can this model, on this hardware, meet our latency and cost SLA at this load?" — with data, not intuition.